

Russia, Iran and $105 Oil: What It Means for US Stocks
Three conflicts, Brent above $105, a hiking Fed and a 5% 10-year: why we rate the S&P 500, Nasdaq and Dow NEUTRAL, plus sector winners and losers.
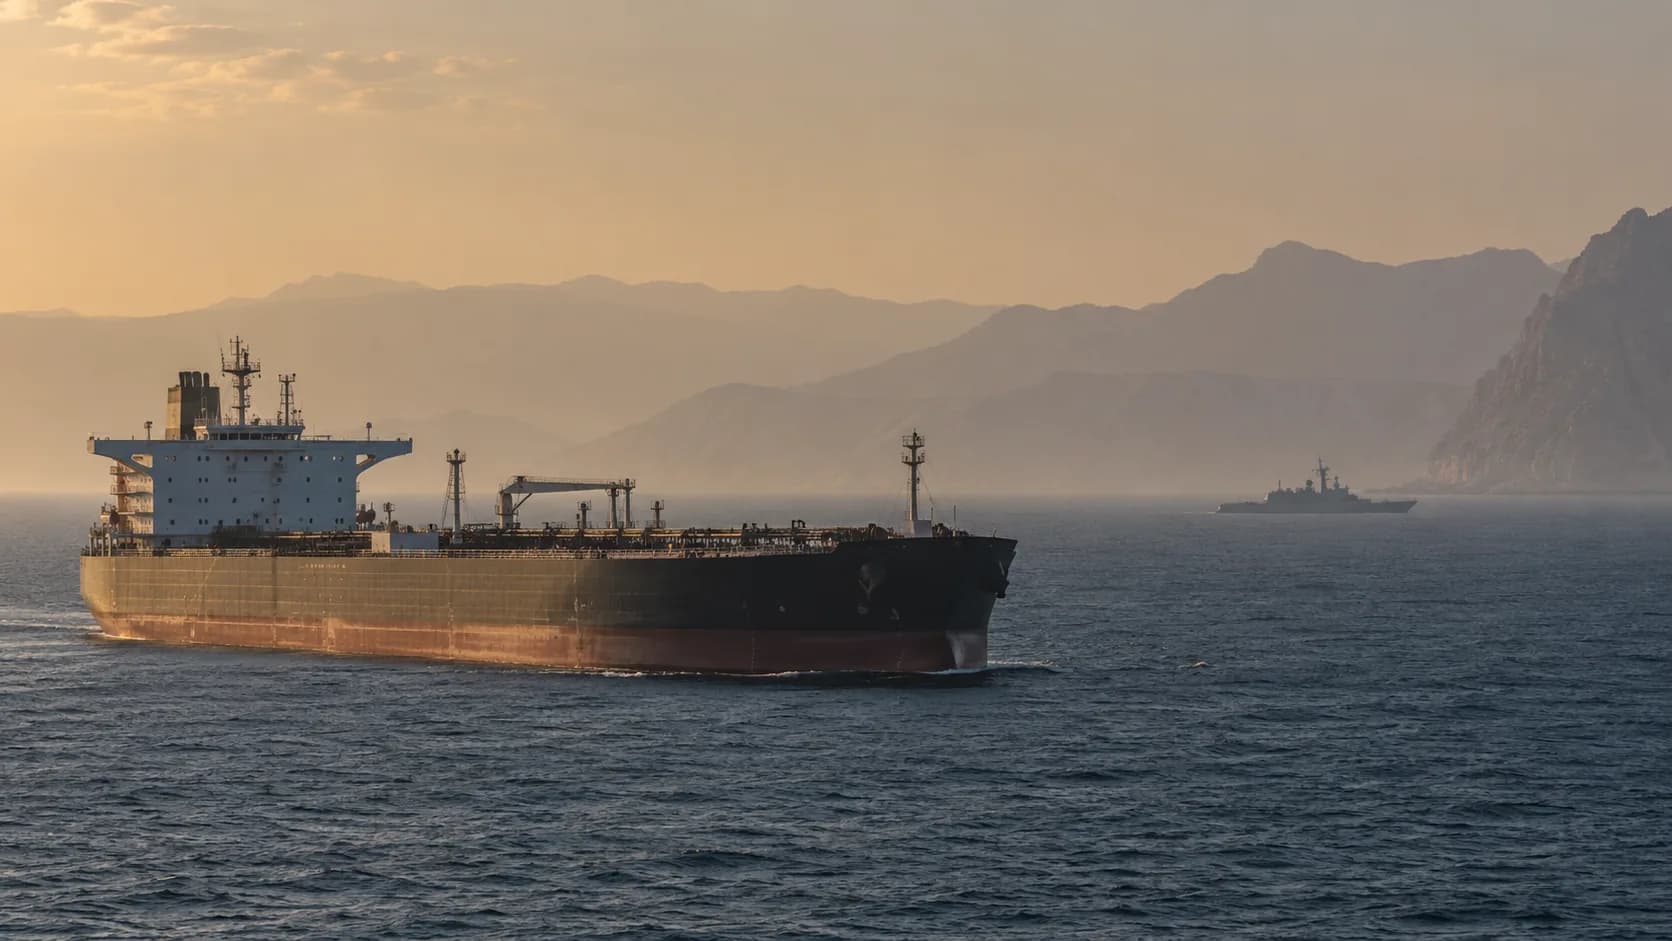
Markets are often said to climb a wall of worry. In October 2026, the wall is built from crude oil. Brent traded near $105.60 a barrel on Tuesday morning, October 13, roughly 45% above its pre-war level of about $73 (Trading Economics, Oct 13, 2026; Moscow Times/Reuters). A day earlier the S&P 500 closed at 7,807.24, up 14% for the year (AP via WTOP, Oct 12, 2026).
The two markets can't both be right. Oil is pricing a world in which the Strait of Hormuz stays contested, refineries keep burning and central banks keep tightening. Equities are pricing an earnings boom that outlasts all three. My argument is that stocks are right about earnings but too relaxed about the discount rate. I expect that tension to resolve sideways, without a crash or a melt-up. What matters for investors is which sectors carry the index in the meantime.
Key Takeaways
- This is not a single "Russia-Iran axis" but three separate conflicts. The first is a U.S.-Iran blockade war with no deal in sight before the November 3 midterms. The second is a transactional U.S.-Russia diesel deal, formalized in OFAC General License 135 on October 9 (NBC News, Oct 9, 2026). The third is a Houthi war that has now reached Saudi Arabia's capital.
- Crude volatility is structural, not headline noise. Oil's implied volatility index (OVX) closed at 48.90 on October 9, more than three times the VIX's 14.84 the same day (FRED OVXCLS; FRED VIXCLS).
- The Fed hiked to 3.75–4.00% on September 16, and 16 of 18 policymakers project at least one more increase in 2026 (Federal Reserve SEP). With the 10-year near 5.2%, the S&P 500's forward earnings yield of about 5.2% offers almost no premium over Treasuries.
- Public-market consensus: NEUTRAL, leaning bullish. Our verdict: NEUTRAL on the S&P 500, Nasdaq and Dow through year-end, with a downside skew until the midterms. Energy, refiners and selected financials win; airlines, consumer discretionary and rate-sensitive yield stocks lose.
Phase 1: The Geopolitical Crucible Is Three Conflicts, Not One Axis
The lazy framing pits a Russia-Iran bloc against a U.S.-led sanctions wall. The evidence describes something messier, and more consequential for markets. Washington is fighting one oil producer and bargaining with another, while a third war spills onto its most important Gulf ally.
Iran: a blockade war with no off-ramp before November
The U.S.-Iran war began with U.S. and Israeli strikes on February 28. A Pakistan-mediated ceasefire in April and a June memorandum of understanding both collapsed. The U.S. resumed its blockade of Iranian ports on July 14 (CBS News, updated Oct 2, 2026). Since then, Central Command says U.S. forces have disabled four ships, turned back 135 and destroyed 10 tankers tied to the Revolutionary Guard's shadow fleet (gCaptain, Oct 11, 2026).
Iran has answered by attacking commercial shipping. Tankers were struck near the UAE on October 9, 10 and 11 (The National, Oct 11, 2026). Kpler counted just seven commodity ships through Hormuz on October 6, against roughly 125 a day before the war (The National, Oct 8, 2026).
Diplomacy is stuck on sequencing. At the UN, Tehran offered to reopen the strait within seven days if Washington lifted the blockade and oil sanctions. President Trump rejected the offer on September 26 (Al Jazeera, Oct 7, 2026). On October 11, senior Iranian official Mohsen Rezaei called the U.S. counter-reply "insufficient." He said Hormuz would stay closed until Iran's conditions were met (Al-Monitor/Reuters, Oct 11, 2026). Trump has said he expects the war to end "right after the election." He has also warned that strikes could resume after the midterms if it doesn't (CBS News). Markets should treat November 3 as a volatility event, not a resolution date.
Russia: sanctions on paper, a diesel deal in practice
On September 18, the president signed the Lindsey O. Graham Sanctioning Russia and Iran Act. It authorizes tariffs of up to 100% on the largest importers of Russian oil and gas and orders the designation of shadow-fleet vessels. Most of its deadlines fall on October 18 (Baker McKenzie, Sep 2026). Three weeks after the signing, Treasury issued General License 135. It authorizes imports of Russian-origin diesel, including into the U.S., until April 7, 2027 (NBC News). Trump described more than 4.8 million tonnes of planned deliveries, and seven senators from both parties called the arrangement illegal (TIME, Oct 11, 2026).
The contradiction is deliberate. The Graham Act's broad national-interest waivers make it a bargaining chip rather than a commitment. Retail diesel averaged $6.199 a gallon in EIA's October 5 reading, up 67% from a year earlier (EIA). At that price, the White House has decided it cannot squeeze two major energy exporters at once before an election.
On October 11, Trump also announced a Russia-Ukraine "energy ceasefire." Zelensky said it "was news" to him, and Russian strikes on Ukrainian power infrastructure continued that day (TIME). Kyiv has said it will keep hitting Russian refineries regardless of the diesel deal (Ukrainska Pravda, citing the FT, Oct 10, 2026). Until the ceasefire is confirmed by both sides, I treat the refinery war as ongoing.
Moscow gains less than it appears. Reuters calculations show Russia's oil and gas tax revenue fell 17% year over year for January through September despite higher prices (The Insider/Reuters, Oct 2026). Russian refinery runs fell to 3.7 million barrels a day in July, the lowest in more than 20 years (KSE Institute, Oct 5, 2026).
The tie between Moscow and Tehran is military, not commercial. The FT and the Institute for the Study of War have reported Russian help with Iranian cruise missiles and targeting data (Defense News, Sep 15, 2026). These are intelligence reports, not confirmed facts, and I found no sign of coordinated oil policy. For investors, the implication is that a thaw with Russia does nothing to calm Hormuz, and a deal on Hormuz would not repair Russian refineries.
Yemen: the war reaches Saudi Arabia
The third front is the one markets watch least. A Houthi missile struck Riyadh's King Khalid airport on October 10, killing 12 people by Saudi civil-aviation figures. The Houthis also claimed an attack on Aramco's Rabigh refinery, which Riyadh has not confirmed (Al Jazeera, Oct 11, 2026). Saudi Arabia is the swing supplier routing crude around Hormuz, so attacks on its territory threaten the very bypass the market is counting on.
Phase 2: Energy Market Dynamics, a Refining Crisis Wearing a Crude Costume
Headline crude understates the stress. Brent futures peaked at $109 on September 15, the same day physical Brent spot hit $132 (EIA Today in Energy, Oct 5, 2026). A gap of more than $20 between paper and physical prices is what happens when buyers need barrels now, while the futures market assumes the shortage will pass.
The supply hole is large but shrinking. EIA estimates that Middle East shut-ins fell from 10.9 million barrels a day at the May peak to 4.8 million in September. Global inventories drew down by 1.9 million barrels a day in the third quarter (EIA STEO, Oct 6, 2026). Strategic Petroleum Reserve stocks fell to 283 million barrels in the week ending October 2 (EIA). That day, G7 leaders agreed to release another 100 million barrels over four months, with diesel front-loaded (Prime Minister of Canada). OPEC+ held November output targets unchanged on October 4 and meets again on November 1 (Moscow Times/Reuters).
On October 12, Goldman Sachs raised its December Brent forecast to $90. Its bull case is $125 and its bear case is in the low $70s (Yahoo Finance, Oct 13, 2026). A spread of more than $50 is itself the message: uncertainty is extreme.
Four structural drivers of crude volatility
- Political deadlines. The Graham Act's October 18 deadlines, the November 1 OPEC+ meeting and the November 3 midterms all fall within three weeks. Any of them can reprice the war-risk premium.
- Depleted buffers. Inventories, the SPR and spare capacity have all been drawn down, leaving little cushion for the next disruption.
- The refining bottleneck. Diesel futures, as distinct from pump prices, remained up more than 110% for the year even after a 4% drop on October 9 (NBC News). Crude can ease while the fuels that move freight stay scarce.
- A forecast path that assumes peace. EIA's Brent outlook falls from $105 in Q4 2026 to $74 by Q4 2027 (EIA STEO), on the assumption that Gulf output returns. If that recovery is delayed, the gap between today's price and the forecast path closes upward. A deal would close it downward.
Phase 3: Macroeconomic Ripple Effects, a Supply Shock Meets a Tightening World
Energy shocks travel through headline inflation, inflation expectations and consumer confidence. All three are flashing amber.
The Fed: hiking into a softening labor market
August CPI rose 3.4% year over year, but core CPI rose just 2.4% (BLS). Headline PCE ran at 3.4% and core PCE at 3.0% (BEA). The gap between headline and core is the oil shock. What worries the Fed is that the shock could seep into expectations. The University of Michigan's preliminary October survey put one-year inflation expectations at 4.7%. Its sentiment index fell to 46.3 from 48.1 in September (University of Michigan).
The FOMC voted 12–0 to raise rates on September 16 (Federal Reserve). According to the minutes, "most participants" see another hike as likely appropriate by year-end (FOMC minutes, Oct 7, 2026). Governor Waller said on October 8 that he anticipates "additional hikes" (Federal Reserve). Futures put the odds of a hold on October 28 at roughly 82%, and the odds of a hike by December at about 83% (Yahoo Finance, Oct 10, 2026).
The Fed is tightening into a cooling labor market. September payrolls rose just 29,000 and unemployment ticked up to 4.2% (BLS, Oct 2, 2026). A rate hike does not reopen a strait or rebuild a refinery; it works by slowing everything else. That is the textbook path from a supply shock to stagflation, the same risk SPXScore flagged when diesel first crossed $6.
The world: synchronized tightening, uneven growth
The IMF's October World Economic Outlook projects global growth of 3.1% in 2026 and global inflation of 4.7%. It assumes oil averages $96 and Hormuz flows resume by March 2027 (AP via ABC News, Oct 12, 2026). Emerging and developing economies are forecast to slow to 3.7% in 2026 from 4.5% in 2025. Europe is more exposed than the U.S.: euro-area inflation jumped to 3.8% in September, with energy prices up 18.8% (Eurostat, Oct 2, 2026). The ECB raised its deposit rate to 2.50% on September 10 (Euronews), and the Bank of Japan lifted its policy rate to 1.25% eight days later (BoJ, Sep 18, 2026).
When every major central bank tightens into the same supply shock, the risk is a collective overshoot. Each bank defends its own credibility, and together they can cut global demand further than any of them intends.
Phase 4: U.S. Stock Market Trajectory and the Verdict
The arithmetic that matters most: a shrinking risk premium
FactSet puts the S&P 500's forward P/E at 19.1, the same as its 10-year average of 19.1 (FactSet Earnings Insight, Oct 9, 2026). That is not a bubble multiple. Its inverse, though, is a forward earnings yield of about 5.2%, roughly level with a 10-year Treasury that closed at 5.22% on October 8 (FRED DGS10) after touching 5.35% intraday on October 7 (Cboe). By that simple earnings-yield comparison, the equity risk premium has shrunk to near zero: investors are taking stock-market risk for almost no extra expected yield over Treasuries. That doesn't predict a crash, but it limits how much more the market can gain from rising multiples. As we explained in our look at the 24-year high in Treasury yields, higher safe yields make bonds a serious competitor.
What keeps the index afloat is earnings. FactSet expects S&P 500 earnings to grow 29.6% in the third quarter and 32.7% in calendar 2026, and a record 72 companies issued positive third-quarter guidance. Prices have risen about 14% this year, far less than expected earnings, so the multiple has compressed. The FOMC minutes noted that this year's equity gains came from earnings, as price-to-earnings multiples declined.
The chart shows how narrow the growth is. Excluding semiconductors, tech earnings growth falls from 65.1% to 24.4%. The market's earnings engine depends on energy, chips and a few platform giants.
Public market consensus versus our verdict
| Signal | Reading | Lean |
|---|---|---|
| Sell-side year-end targets (Yardeni 8,400, RBC 8,150, Citi 8,100, U.S. Bank 8,040, Goldman 8,000, BofA 7,100) | Median ~8,070, about +3% from 7,807 | Mildly bullish |
| FactSet bottom-up 12-month target | 9,290.58 | Bullish |
| AAII retail sentiment (week to Oct 7) | 40.3% bullish, 20.8% neutral, 39.0% bearish | Neutral |
| VIX (Oct 9) | 14.84 | Complacent |
Sources: Yahoo Finance/Qz, Sep 9, 2026; Yahoo Finance/Stocktwits, Jun 2026; CNBC, May 27, 2026; FactSet; AAII; FRED.
Strategist targets range from 7,100 to 8,400, and every one was published before the September hike and before the 10-year rose above 5%. I give them less weight for that reason. The bottom-up target is a mechanical sum of analysts' estimates for individual stocks, and those estimates have historically run optimistic. Retail investors are split almost evenly between bulls and bears.
- Public-market consensus: NEUTRAL, leaning bullish. The Street expects modest gains, but not with conviction.
- Our verdict: NEUTRAL, with a downside skew until November 3. Earnings support the index, and the discount rate caps it.
| Index | Oct 12 close | YTD | Verdict | Year-end base range | Why |
|---|---|---|---|---|---|
| S&P 500 | 7,807.24 | +14.0% | NEUTRAL | ~7,400–8,100 | Strong earnings offset a near-zero risk premium |
| Nasdaq Composite | 27,245.90 | +17.2% | NEUTRAL, widest range | ~25,000–28,600 | AI earnings power versus the greatest sensitivity to long yields |
| Dow Jones Industrial Average | 51,850.55 | +7.9% | NEUTRAL, relative outperformer | ~49,800–53,900 | Heavier industrial and financial exposure, lighter long-duration tech, suits high yields |
Index levels from AP via WTOP, Oct 12, 2026. Ranges and verdicts are the author's analysis.
Sector winners and losers
Winners
- Energy producers. They have the fastest earnings growth in the index (121.1%) and the lowest forward P/E (13.5, per FactSet). A peace deal is the main risk, so favor low-cost producers over those most leveraged to the spot price.
- Refiners. FactSet expects refining and marketing earnings to rise 462% year over year. Refiners are the most direct play on the diesel shortage, though Russian diesel imports will chip away at margins.
- Financials. Higher short-term rates support net interest income. Banks begin reporting on October 13–14, which will test whether credit costs are rising.
- Defense and maritime security. Demand is real, but valuation data on these names is thin, so size positions conservatively.
Losers
- Airlines. Delta cut its 2026 EPS guidance to $5.10–5.60 from $6.50–7.50 and expects about $6 billion more in fuel costs (Al Jazeera, Oct 9, 2026). Fuel is erasing roughly a quarter of expected profit despite strong demand.
- Consumer discretionary. The sector carries the highest forward P/E (23.2, per FactSet) just as consumer sentiment sits at 46.3. Cruise lines are a case study, covered in our cruise-line value-trap analysis.
- Utilities, REITs and other yield plays. A 4% dividend yield is hard to sell against a 10-year near 5.2%.
- Freight-heavy transports and chemicals. Diesel and feedstock costs are rising faster than these companies can reprice their contracts.
Three scenarios through year-end
| Scenario | Probability (author's estimate) | Trigger | Brent | S&P 500 | Nasdaq | Dow |
|---|---|---|---|---|---|---|
| Bear | 25% | Strikes resume after the midterms, Hormuz traffic falls further, the Fed hikes twice | $110+ | 6,700–7,100 | 22,300–24,000 | 46,100–48,200 |
| Base | 55% | Stalemate persists, bypass flows hold, one more Fed hike in December | $90–110 | 7,400–8,100 | 25,000–28,600 | 49,800–53,900 |
| Bull | 20% | An Iran deal reopens Hormuz and the Fed signals a peak in rates | $70s–80s | 8,200–8,600 | 29,200–30,800 | 54,300–56,000 |
What to Watch Over the Next Three Weeks
- September CPI on October 14. The Cleveland Fed's nowcast points to about 3.6% headline (Cleveland Fed). A core reading above 2.5% would signal that the shock is spreading.
- The Graham Act deadlines on October 18. Watch whether the White House imposes tariffs on buyers of Russian oil or waives them.
- The FOMC decision on October 28. A hold is priced in; the risk lies in the guidance.
- The OPEC+ meeting on November 1 and the midterms on November 3. These are the two dates most likely to reset the war-risk premium.
- Hormuz transit counts and Brent's premium over WTI. That gap was about $13 on October 13 (Trading Economics), a sign that physical scarcity is concentrated outside the U.S.
Conclusion: Own the Earnings, Respect the Discount Rate
The geopolitical map is unstable but not incoherent. Washington is fighting Iran at sea while trading sanctions relief to Russia for diesel, because it cannot absorb both supply shocks at once. In the base case, that keeps oil volatile but contained: well above pre-war levels, but held down by bypass flows, SPR releases and Russian fuel. The result is inflation the Fed has to answer, a 10-year yield that has squeezed the equity risk premium to near zero, and an S&P 500 held up by exceptional earnings growth.
My verdict is NEUTRAL: expect a range-bound index with rotating leadership, not a breakdown. Size positions to survive a 10–15% drawdown around the midterms. Overweight the companies whose earnings the oil shock lifts, chiefly producers, refiners and selected financials. Underweight those whose earnings it erodes, chiefly airlines and discretionary spending. You can track forward estimates for your holdings on our trends dashboard. If the war ends, earnings will drive this market. If it doesn't, the discount rate will.
This article discusses geopolitical developments, commodity prices and market conditions as of October 13, 2026, for informational purposes only. It is not investment advice or a recommendation to buy or sell any security. Economic data is subject to revision. Reports of Russian military assistance to Iran are based on intelligence reporting and have not been independently confirmed. Scenario probabilities and index ranges are the author's estimates, not forecasts by any cited institution.